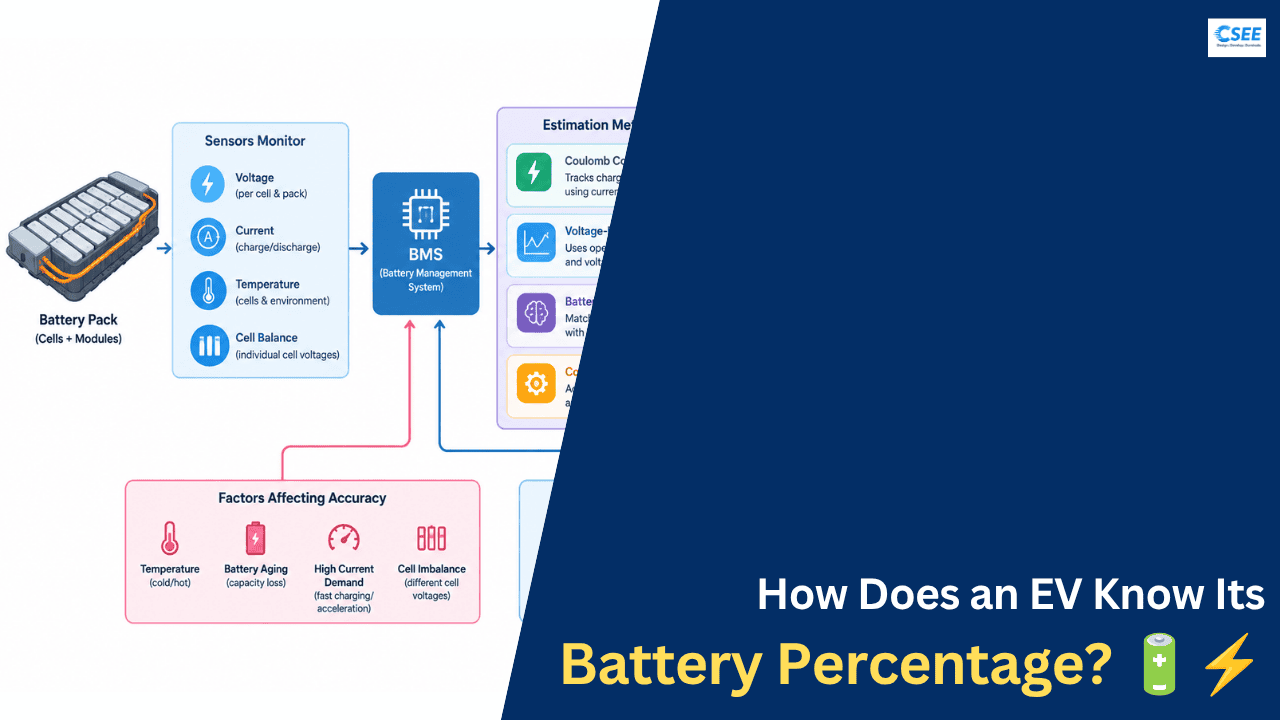
How Does an EV Know Its Battery Percentage? 🔋⚡
Your EV dashboard says 80%, 50% or 10%. It feels like a simple reading, like a fuel gauge. It is not. A battery has no sensor that reports “percent full”. The number is an estimate, produced continuously by the Battery Management System (BMS).
1. Why battery percentage can’t be measured directly
A petrol tank is easy: a float sits on the fuel surface and its height tells you the volume. A lithium-ion battery stores energy in chemical form, in the positions of lithium ions inside electrode materials. You cannot put a ruler into that. What you can measure from outside is only electrical: how many volts across the terminals, how many amps flowing, and how warm it is.
So the BMS has to infer the hidden internal state from these outside measurements. In engineering, a quantity that is inferred rather than measured is called a state estimate. SOC is one of them.
Example from the basics: if the usable capacity is 60 kWh and about 48 kWh is available, then 48 ÷ 60 = 0.80, so SOC ≈ 80%.
2. Meet the Battery Management System (BMS)
The BMS is the electronic brain of the pack. It is a set of circuit boards and software attached to the battery. Its jobs include protection, balancing, communication and, most relevant here, state estimation.
What the BMS measures
| Input | Typical sensor | What it tells the BMS |
|---|---|---|
| Cell voltage | Analog front-end chip | Rough charge level at rest, cell health, limits for protection |
| Pack current | Shunt resistor or Hall sensor | How much charge moved in or out (basis of Coulomb counting) |
| Temperature | NTC thermistor | Adjusts capacity, resistance and power limits |
| Insulation / contactor status | Isolation monitor | Safety, not SOC, but it decides whether the pack may run |
3. Technique #1: Coulomb counting
Coulomb counting is the most important method. A coulomb is a unit of electric charge; one ampere flowing for one second equals one coulomb. If you track current over time, you know how much charge has entered or left the battery. It works like a bank account: deposits (charging) go up, withdrawals (driving) go down.
A worked example
- Battery usable capacity: 60 kWh. Starting SOC: 80% → 48 kWh available.
- You drive and use 6 kWh of energy.
- Available energy is now 42 kWh.
- New SOC = 42 ÷ 60 = 70%.
The catch: drift
Coulomb counting is smooth and responsive, but errors accumulate. A current sensor with a tiny offset error, say 0.1 A, integrates to a growing mistake over hours. Sensor noise, sampling delays, self-discharge and unknown starting values all add up. Left alone, the estimate wanders away from reality, exactly like a clock that gains a few seconds every day.
4. Technique #2: Voltage-based estimation
A battery’s voltage depends on how full it is. When a battery has rested with no current for a while, its terminal voltage equals the Open Circuit Voltage (OCV), which maps closely to SOC. The BMS stores a lookup table: OCV against SOC, created in the lab for that cell chemistry.
NMC and NCA cells show a voltage that changes noticeably as the charge changes, so a voltage reading tells you a lot. LFP cells (common in many standard-range EVs) have a long flat plateau: between roughly 20% and 90% the voltage moves by only a few tens of millivolts. A tiny voltage error there becomes a huge SOC error. That is why LFP estimation leans harder on Coulomb counting and models, and why some LFP cars ask for a periodic 100% charge.
Why voltage alone isn’t enough
- Under load, voltage sags. Internal resistance causes a voltage drop while current flows. Hard acceleration makes voltage look lower than the true OCV.
- Voltage recovers after load. After you stop, the voltage rises slowly as ions diffuse and equalize. Waiting takes minutes to hours.
- Hysteresis. The voltage at a given SOC can differ depending on whether you got there by charging or discharging.
- Temperature. Cold shifts the curve and raises resistance.
5. Technique #3: Battery models
To interpret voltage during real driving, the BMS uses a mathematical battery model. The most common is the equivalent circuit model (ECM): a small electrical circuit whose behaviour mimics the battery.
Using such a model, the BMS can compute what the voltage should be for a given SOC, current and temperature, and compare it with the actual measured voltage. The difference is the clue that the SOC estimate is off.
6. Technique #4: Correction algorithms (Kalman filters)
How do you blend a smooth-but-drifting method (Coulomb counting) with a noisy-but-anchored method (voltage)? The classic answer is the Kalman filter and its variants (Extended Kalman Filter, Unscented Kalman Filter). Each cycle has two steps:
- Predict. Use Coulomb counting and the model to predict the new SOC and the expected voltage.
- Correct. Compare predicted voltage with the measured voltage. Nudge the SOC estimate by an amount that depends on how much the BMS trusts the sensors versus the model.
The result: the estimate stays smooth like Coulomb counting, yet cannot drift far because voltage evidence keeps pulling it back. Some modern systems also use machine-learning models trained on huge amounts of battery data, often together with a Kalman filter rather than instead of it.
| Method | Strength | Weakness | Best used for |
|---|---|---|---|
| Coulomb counting | Smooth, fast, simple | Drifts over time; needs known start and capacity | Short-term tracking while driving |
| Voltage / OCV lookup | Anchored to physical reality | Only accurate at rest; weak on flat curves | Initial SOC, recalibration |
| Battery model | Explains sag and recovery | Needs tuning; changes with age | Estimating during load |
| Kalman filter | Fuses everything, self-corrects | Computationally heavier, needs good model | Main real-time estimator |
| Machine learning | Can capture complex patterns | Needs data, harder to verify | Supplementing the above |
7. What disturbs the calculation
🌡️ Temperature
Cold slows the chemistry. Internal resistance rises, voltage sags more, and part of the capacity becomes temporarily unavailable. A pack that gives 60 kWh at 25 °C may deliver noticeably less near freezing. The BMS uses temperature to adjust the model and capacity, which is why range estimates fall in winter but often recover as the pack warms.
⚙️ Charge and discharge rate
Higher current (fast charging, hard acceleration) increases voltage error and reduces the energy you can extract. The Peukert-like effect means high currents make the battery “look” emptier temporarily.
🧩 Differences between cells
A pack contains hundreds or thousands of cells. No two are identical: capacity, resistance and self-discharge differ slightly. The weakest cell decides when charging must stop and when driving must stop. The BMS therefore tracks the highest and lowest cell, and the pack SOC reflects this.
Balancing can be passive (burn extra energy from higher cells through a resistor) or active (move energy between cells). It usually happens near the top of charge or while resting.
⏳ Ageing
Every cycle and every year slowly reduces capacity and raises resistance. That means the “bucket” from Figure 2 shrinks. The BMS tracks this as State of Health (SOH):
| Battery age | Example SOH | Usable capacity (60 kWh new) | Energy at “80%” display |
|---|---|---|---|
| New | 100% | 60 kWh | 48 kWh |
| 3 years | 95% | 57 kWh | 45.6 kWh |
| 6 years | 90% | 54 kWh | 43.2 kWh |
| 10 years | 82% | 49.2 kWh | 39.4 kWh |
Notice that the dashboard still says 80%, but 80% means 80% of what the battery can hold today. If the BMS did not update the capacity, an old pack would show 20% and then suddenly die. Tracking capacity fade is essential to keep the percentage honest. Values above are examples; real degradation depends on chemistry, climate and use.
8. Total capacity vs usable capacity: the hidden buffers
Manufacturers do not let you use the full physical range of the cells. Running at 0% or 100% stresses the chemistry. So the pack has a gross capacity, a smaller net (usable) capacity, and protective buffers at both ends.
| Term | Meaning |
|---|---|
| Gross capacity | Total energy the cells could store physically |
| Net / usable capacity | Energy the car allows you to use |
| Displayed SOC | Percentage of the usable window that remains |
| Real (BMS) SOC | Internal figure, sometimes on a wider scale |
Some cars also apply a display curve. For example, they may hold the dashboard at 100% for a short while after full charge, or slow the drop near the bottom to leave a safety margin. The shown percentage is therefore both an estimate and a designed user experience.
9. How the BMS starts and resets its estimate
- Wake-up. After the car has been parked for hours, cell voltages have relaxed. The BMS reads OCV and looks up SOC. This is the most accurate anchor point.
- Driving. Coulomb counting with model and Kalman corrections tracks every amp.
- Charging. Near the end of charging, the voltage hits its limit and current tapers. The BMS knows the cells are essentially full and resets SOC to 100%.
- Deep discharge. Reaching the lower voltage limit gives another anchor at the bottom end.
- Capacity update. Measuring how much charge went in between two known SOC points reveals the true capacity and updates SOH.
10. Why your car’s percentage sometimes acts strangely
| What you notice | Likely reason |
|---|---|
| Percentage drops faster in winter | Cold reduces available capacity, increases resistance and cabin heating consumes energy |
| It jumps up slightly after parking | Voltage recovered at rest and the estimator re-anchored to OCV |
| Fast drop from 100% to 95% | Display curve or top-of-charge voltage relaxation |
| Sudden fall near 10–20% on LFP | Voltage curve steepens at the low end, model corrects the estimate |
| Percentage differs from range estimate | Range uses SOC plus a prediction of consumption; they are different calculations |
| Same percentage, less range over years | Battery ageing reduced the actual kWh behind each percent |
11. SOC, SOH, SOP and range: not the same thing
12. How accurate is it?
A well-designed EV BMS typically keeps SOC error within a few percent under normal conditions. Accuracy is best after a rest and near known anchor points, and can be worse at extreme temperatures, on very flat voltage curves or in old packs. Errors are managed conservatively: the system prefers to under-report rather than let you run flat unexpectedly, and it protects the battery with power limits when the estimate is uncertain.
13. Practical tips for drivers
- Do not worry about small percentage jumps; they are estimator corrections.
- Follow the manufacturer’s advice about occasional full charges, especially for LFP packs.
- Precondition in cold weather to raise pack temperature and improve accuracy and range.
- Judge battery health by SOH or a range trend over months, not one day’s percentage.
- Keep software updated; manufacturers refine SOC algorithms and models over time.
Summary
- The battery percentage is estimated, not directly measured.
- The BMS senses voltage, current, temperature and cell behaviour.
- Coulomb counting tracks charge in and out; it is smooth but drifts.
- Voltage-based estimation anchors the value, best after rest and on steep voltage curves.
- Battery models and Kalman filters fuse both and correct errors in real time.
- Temperature, current, cell differences and ageing all disturb the calculation, so the BMS compensates for each.
- As the battery ages, the BMS updates capacity, so 80% today means 80% of a slightly smaller battery than when new.
So the next time your dashboard shows 80%, remember: it is the output of real-time sensing, algorithms and battery models working together inside the BMS. 🔋⚡