ISO 26262:2018 · Road Vehicles — Functional Safety
Functional Safety for an
EV Battery Management System
A step-by-step engineering walkthrough of the full safety lifecycle for a battery management system — from defining the item, through hazard analysis, safety concepts and analyses, to verification, validation, and the safety case. With diagrams, worked examples, and reference tables throughout.
Orientation
Foundations — the V-model and ASIL
Before the individual work products make sense, two ideas hold the whole standard together: the safety lifecycle (drawn as a V), and the ASIL — the risk class that decides how much rigour each requirement gets.
The whole lifecycle is easiest to learn by watching a single hazard travel through it. Throughout, look for the ⛓ golden thread marker: it follows cell overcharge → SG1 from the moment it’s identified, through its safety goal, requirements, mechanisms, analyses, and finally the test that proves it’s handled. If you only follow one thing, follow that.
ISO 26262 organises automotive safety work as a V-model. The left arm goes top-down: you start with the whole item and refine it step by step into a concept, then technical requirements, then a design you can build. The bottom is implementation. The right arm comes back up: each level you specified on the left is verified by a matching level of integration and test on the right, ending in validation of the complete item in the vehicle. Every box on the left has a partner on the right.
The standard is split into parts
You don’t apply all of ISO 26262 at once — different parts own different phases. For a BMS, these are the ones you live in:
| Part | Title | What it gives the BMS work |
|---|---|---|
| Part 2 | Management of functional safety | The Safety Plan, roles, and the confirmation measures (reviews, audit, assessment) that close out the Safety Case. |
| Part 3 | Concept phase | Item Definition, HARA, Safety Goals, and the Functional Safety Concept (FSRs). |
| Part 4 | System level | Technical Safety Concept (TSRs), system integration, and safety validation. |
| Part 5 | Hardware level | Hardware architectural metrics (SPFM, LFM) and the PMHF — the quantitative evidence from FMEDA. |
| Part 6 | Software level | Software safety requirements, architecture, unit design and verification for the BMS firmware. |
| Part 8 | Supporting processes | Requirements management, configuration, change, tool qualification, and the DIA between partners. |
| Part 9 | ASIL-oriented analyses | ASIL decomposition, criteria for coexistence, and dependent-failure analysis (DFA). |
ASIL — how much rigour a requirement earns
The Automotive Safety Integrity Level is the heart of the standard. Every hazard is rated, and that rating flows down to every requirement, mechanism, and test that addresses it. There are five levels. Higher means more dangerous, which means more demanding methods, more independence in reviews, and tighter hardware metrics.
Item — the system being assessed (here, the BMS). Safety goal — a top-level safety requirement, carrying an ASIL. Safe state — an operating mode with no unreasonable risk (for a BMS, often “high-voltage disconnected”). Fault → Error → Failure — a fault is the cause, an error the wrong internal state, a failure the loss of correct function at the boundary.
How a fault becomes a hazard
This three-word chain — fault → error → failure — is the mental model behind every safety mechanism. A fault is a root cause (a broken wire). It produces an error, a wrong internal state (a cell reads false-low). The error becomes a failure when the function is lost at the boundary (a real overvoltage goes undetected). The entire job of a safety mechanism is to break this chain — to catch the error before it becomes a failure, and steer the system to a safe state.
ISO 26262-3 · Clause 5
Item Definition
Everything downstream is built on this. The Item Definition draws a precise boundary around the BMS — what it does, where it stops, what it connects to, and the conditions it must work in. Get the boundary wrong and the hazard analysis misses things.
What goes into it
The Item Definition answers four questions about the BMS: its functions, its boundary and interfaces, its operating modes and environment, and the assumptions and dependencies placed on the rest of the vehicle. The functions are the obvious starting point.
| Function | Purpose | Boundary |
|---|---|---|
| Cell voltage monitoring | Measure every cell / cell-group voltage to keep each within its safe window. | Owns sensing; relies on the AFE ICs. |
| Temperature monitoring | Track cell and module temperatures to prevent thermal limits being exceeded. | Owns sensing & thresholds. |
| Current measurement | Measure pack current for protection, SoC, and power limits. | Owns the shunt / sensor reading. |
| SoC / SoH estimation | Estimate state of charge and health to inform limits and the VCU. | Owns the algorithm. |
| Contactor control | Open / close the main and precharge contactors to connect or isolate the HV bus. | Owns the command & diagnostics. |
| Cell balancing | Equalise cell charge to maximise usable capacity and life. | Owns balancing control. |
| Protection & limits | Enforce voltage / current / temperature limits and request a safe state on violation. | Core safety function. |
| Communication | Report status and limits to the VCU / charger over CAN. | Owns the BMS side of the bus. |
The BMS in its system context
A boundary is easiest to see drawn out. Below is a representative BMS architecture — the signal/low-voltage domain in teal, the high-voltage power path in orange. This same diagram becomes the canvas later, when safety mechanisms get mapped onto the blocks.
Operating modes, environment, assumptions
The definition also pins down the modes the BMS runs in — off / sleep, standby, drive, charging (AC/DC), balancing, fault / limp — and the environment: temperature range, vibration, EMC, and the supply it depends on. Finally it records assumptions on the rest of the vehicle (for example, that the VCU will reduce torque demand when the BMS signals a power limit). These assumptions become assumed requirements on other items and must be agreed, not just hoped for.
The HARA can only find hazards for functions and failure modes that the Item Definition put on the table. A function left out here — say, an undocumented fast-charge mode — is a hazard that never gets analysed. This is the most common root cause of a safety gap, and it is the cheapest one to prevent.
ISO 26262-3 · Clause 6
Hazard Analysis & Risk Assessment
The HARA is where risk gets named and measured. You imagine the BMS failing in real driving situations, judge how bad each outcome could be, and turn that judgement into an ASIL and a safety goal. It is the single most consequential analysis in the whole programme.
The method in three moves
For each function you consider what happens when it fails — too high, too low, stuck, late, missing. You place that failure in an operational situation (driving on a motorway, charging overnight, parked) to form a hazardous event. Then you rate that event on three axes, and the three ratings together fix the ASIL.
What the three axes mean
How bad is the harm?
S0 none · S1 light/moderate · S2 severe, survival probable · S3 life-threatening or fatal.
How often is the situation faced?
E0 incredible · E1 very low · E2 low · E3 medium · E4 high (e.g. normal driving).
Can the driver avoid harm?
C0 controllable in general · C1 simply · C2 normally · C3 difficult or uncontrollable.
One ASIL per event
The worst realistic combination of S, E and C sets the level. The most severe BMS hazards reach ASIL D.
The ASIL determination table
This is the lookup behind FIG. 4. Read it as: pick the Severity block, then the Exposure row, then the Controllability column. Note how many combinations land at QM — risk has to be both likely and hard to control before it climbs.
| Severity | Exposure | C1 | C2 | C3 |
|---|---|---|---|---|
| S1 light / moderate | E1 | QM | QM | QM |
| E2 | QM | QM | QM | |
| E3 | QM | QM | A | |
| E4 | QM | A | B | |
| S2 severe, survivable | E1 | QM | QM | QM |
| E2 | QM | QM | A | |
| E3 | QM | A | B | |
| E4 | A | B | C | |
| S3 life-threat. / fatal | E1 | QM | QM | A |
| E2 | QM | A | B | |
| E3 | A | B | C | |
| E4 | B | C | D |
S0 (no harm) yields QM in every case and is omitted. E0 (incredible) likewise yields QM and is omitted.
A worked BMS HARA
Putting it together for the BMS gives entries like these. Each row produces one safety goal, carrying the ASIL of its hazardous event — these goals drive everything from Step 3 onward.
| Hazard (malfunction) | Situation | Potential effect | S / E / C | ASIL | Safety goal |
|---|---|---|---|---|---|
| Cell overvoltage (overcharge) | DC fast charging, high SoC | Cell damage → thermal runaway, fire | S3/E3/C3 | C | SG1 Prevent any cell exceeding its upper voltage limit. |
| Cell overtemperature | Driving / charging | Thermal runaway, fire, propagation | S3/E4/C3 | D | SG2 Prevent cell temperature exceeding its safe limit. |
| Pack overcurrent | Hard acceleration / external short | Overheating, arc, fire | S3/E3/C3 | C | SG3 Limit or interrupt pack current on overcurrent. |
| Cell over-discharge (undervoltage) | Driving at low SoC | Cell degradation, latent failure | S2/E2/C3 | A | SG4 Prevent any cell below its lower voltage limit. |
| Unintended contactor opening | Driving | Sudden loss of propulsion | S3/E4/C2 | C | SG5 Avoid unintended HV disconnection while driving. |
| Contactor stuck closed | Fault / crash needing isolation | HV present when it must be removed | S3/E2/C3 | B | SG6 Ensure HV can be disconnected on demand. |
The S/E/C values above are illustrative, to show the mechanics. A real HARA argues each rating with evidence (crash data, field exposure, controllability studies) and is reviewed independently — the ASIL it fixes will shape cost and effort for the entire project, so it is never assigned casually.
Worked example — reading two of the ratings
The table can feel like magic until you see the reasoning. Here is how two rows were argued, axis by axis — this is the kind of justification a real HARA records for every entry.
S3 — a thermal runaway can cause fire and is potentially fatal, the top severity. E4 — the triggering situations (driving, charging) are part of everyday use, so exposure is high. C3 — a driver cannot sense or stop a cell-level thermal event, so it is uncontrollable. S3 + E4 + C3 sits in the single worst cell of the table → D.
S3 — overcharge can also lead to thermal runaway. E3 — it is tied to high-SoC fast charging, frequent but not constant, so medium rather than high exposure. C3 — again outside the driver’s control. Dropping exposure from E4 to E3 moves the result down one level → C. One axis changed the whole effort budget.
From here on we follow cell overcharge. It has just become SG1 — “Prevent any cell exceeding its upper voltage limit,” ASIL C. Watch it pick up requirements, a mechanism, an analysis, and finally a test.
ISO 26262-3 · output of the HARA
Safety Goals, Safe States & FTTI
A safety goal is the top of the requirement tree — one per hazardous event, written in the vehicle’s language, not the component’s. To be testable it needs two companions: the safe state it drives toward, and the FTTI, the time budget it has to get there.
Safe state
The safe state is the condition the BMS moves to when it can no longer guarantee correct operation — a state with no unreasonable risk. For most BMS hazards the safe state is high-voltage disconnected (open the contactors). Sometimes it is gentler — limit current or limp-home — because an abrupt disconnect can create a new hazard (loss of propulsion). Choosing it is a safety decision in itself.
FTTI — the time budget
A fault does not become a hazard instantly. The Fault Tolerant Time Interval is the window from a fault occurring to the hazard happening, if nothing intervenes. The BMS must detect the fault and react to reach the safe state inside that window — with margin to spare.
| Goal | Safety goal | ASIL | Safe state | FTTI (indicative) |
|---|---|---|---|---|
| SG1 | Prevent cell overvoltage | C | Stop charge current, open contactors | ~ 1 s |
| SG2 | Prevent cell overtemperature | D | Open contactors, controlled shutdown | seconds |
| SG3 | Limit / interrupt overcurrent | C | Open contactors | ~ 10–100 ms |
| SG4 | Prevent cell over-discharge | A | Limit load, then disconnect | seconds |
| SG5 | Avoid unintended HV disconnect | C | Stay connected; warn & derate | driver-paced |
| SG6 | Ensure HV disconnect on demand | B | Redundant disconnect path | on demand |
FTTI figures are illustrative — actual values come from physical analysis of how fast each fault propagates to harm.
FTTI with real numbers
The abstract timing diagram lands better with a concrete case. Take an external short (SG3, overcurrent), where the budget is tight. Suppose analysis shows the pack reaches a dangerous condition about 100 ms after the short. The BMS must detect and react well inside that:
What the BMS actually does — its safety states
Safe states aren’t just “on” or “off”. A well-designed BMS degrades in stages: it keeps running normally until a limit is approached, warns and reduces power in a middle band, and only disconnects when a true safety limit is crossed. Drawing it as a state machine makes the logic obvious.
ISO 26262-3 · Clause 7
Functional Safety Concept & FSRs
The safety goals say what must not happen. The Functional Safety Concept says how, in functional terms — without yet committing to specific hardware. It breaks each goal into functional safety requirements (FSRs) and allocates them to elements of the architecture.
From a goal to its FSRs
A functional safety concept typically covers four things per goal: detecting the fault, reacting to reach the safe state within the FTTI, warning the driver or degrading gracefully, and ensuring the detection itself is dependable (so a single sensing fault can’t blind it). Taking SG1 (prevent overcharge, ASIL C):
| FSR | Functional safety requirement | Allocated to | ASIL |
|---|---|---|---|
| FSR 1.1 | Detect when any cell voltage exceeds the safe upper threshold. | Cell monitoring + controller | C |
| FSR 1.2 | On detection, command the safe state (stop charge / open contactors) within the FTTI. | Controller + contactors | C |
| FSR 1.3 | Notify the driver and charger, and record the fault. | Controller + CAN | C |
| FSR 1.4 | Ensure voltage detection tolerates a single measurement-chain fault (redundancy / diagnostics). | Cell monitoring path | C |
ASIL decomposition — splitting the burden
A high ASIL is expensive to meet in one element. ISO 26262-9 allows an ASIL to be split across two sufficiently independent elements, each carrying a lower ASIL while the combination still meets the original. The catch is the word independent: you must prove freedom from interference with a dependent-failure analysis, or a common cause undoes the whole scheme.
ISO 26262-4 · Clause 6
Technical Safety Concept & TSRs
Now the concept meets silicon. The Technical Safety Concept refines each functional requirement into technical safety requirements (TSRs) on specific hardware and software, names the safety mechanisms that realise them, and defines the hardware–software interface (HSI) where the two meet.
From FSR to TSR
Where an FSR said “detect overvoltage, tolerant to a single fault”, a TSR says exactly how: two independent measurement paths, compared every cycle, with the AFE running internal self-tests at a defined interval. Continuing the SG1 / overcharge thread:
| TSR | From | Technical safety requirement | Safety mechanism | ASIL |
|---|---|---|---|---|
| TSR 1.1 | FSR 1.1/1.4 | Provide two independent cell-voltage measurements per cell-group; compare each cycle; flag deviation beyond tolerance. | Redundant sensing + plausibility | C |
| TSR 1.2 | FSR 1.1 | AFE runs internal self-tests (reference, open-wire, ADC) each diagnostic cycle within the FDTI budget. | Diagnostic monitoring | C |
| TSR 1.3 | FSR 1.2 | On an overvoltage flag, the controller de-energises the main contactors within the reaction time so FDTI + FRTI < FTTI. | Safe-state actuation | C |
| TSR 1.4 | FSR 1.2 | Confirm contactor state via auxiliary feedback; on mismatch, escalate to the redundant disconnect path. | Contactor diagnostics | C |
| TSR 1.5 | all | An independent watchdog supervises controller liveness and timing; loss of service forces the hardware safe state. | Windowed watchdog | C |
The hardware–software interface specification records exactly what each diagnostic register means, which signals are safety-relevant, and the timing the software may assume. When hardware and software are built by different teams (or different companies), the HSI is the contract that keeps a safety mechanism from falling through the gap between them.
Realising the TSRs
Safety Mechanisms — a deep dive
Safety mechanisms are the working parts of the concept — the things that actually catch faults and steer the system to safety. Think of them as layers of defence: a fault has to slip past every one to cause harm.
The four mechanism families
Two eyes, not one
An independent second channel measures the same quantity. Agreement builds confidence; disagreement beyond tolerance is itself a detected fault.
The system tests itself
Periodic self-tests — reference checks, open-wire detection, RAM/ROM tests, comms CRC — find internal faults before they can combine into a failure.
Does this reading make sense?
Values are checked against physics and against each other (current vs. voltage change vs. model). Implausible combinations flag a fault no single-signal range check would catch.
Is the brain still alive?
An independent timer expects to be serviced within a time window. Too early or too late — a sign of a hung or runaway controller — forces a hardware safe state without the software’s help.
| Mechanism | Fault class it detects | How it works | Typical DC |
|---|---|---|---|
| Redundant sensing | Sensor / channel faults, drift, stuck values | Cross-check an independent second measurement | high (→99%) |
| Diagnostic monitoring | Internal IC, memory, communication faults | Scheduled self-tests & integrity checks | medium–high |
| Plausibility checks | Implausible or cross-inconsistent signals | Validate against physics & other signals | medium |
| Windowed watchdog | Controller hang, lockup, timing faults | Independent in-window service check | high (its class) |
“DC” is diagnostic coverage — the fraction of a component’s dangerous failure rate that the mechanism detects. These figures feed directly into the FMEDA in the next step.
How redundant sensing actually catches a fault
“Redundant sensing” sounds abstract until you see the comparison at its heart. Two independent paths measure the same cell. If they agree, the value is trusted. If they drift apart by more than a set tolerance, that disagreement is the fault signal — no single broken path can quietly report a false-low voltage anymore.
How a windowed watchdog catches a hung controller
The watchdog is independent hardware that expects the controller to “check in” — but only inside a specific time window. Check in too late (the CPU has hung) or too early (the CPU is looping wildly) and the watchdog fires, forcing the safe state without trusting the software at all.
SG1’s “detect overvoltage” requirement is now realised by exactly the pattern above: two independent cell-voltage paths cross-checked, backed by AFE self-diagnostics. A single broken sense path becomes a detected disagreement — not a missed overvoltage. Next we prove that coverage with numbers.
ISO 26262-5 / -9
Safety Analyses — FMEA, FMEDA, FTA
Three analyses verify the concept from three directions. FMEA works upward from component failures, FMEDA turns that into hardware numbers, and FTA works downward from the hazard. Together they show the safety mechanisms actually cover what they claim to.
FMEA — bottom-up, qualitative
A Failure Mode and Effects Analysis walks every component, asks how it can fail, and traces each failure mode up to its effect on the system and the safety goal. Crucially it records the safety mechanism that catches each one — exposing any failure mode that has no defence.
| Component | Failure mode | System effect | Detecting mechanism | Sev. |
|---|---|---|---|---|
| Cell voltage channel | Reads low (short / stuck) | True overvoltage masked → SG1 at risk | Redundant channel + open-wire diag. | S3 |
| Temperature sensor | Open circuit | Overtemperature masked → SG2 at risk | Open-wire detection + redundancy | S3 |
| Current sensor | Gain / offset error | Overcurrent under-read → SG3 at risk | Plausibility vs. voltage & model | S3 |
| Main contactor | Welds closed | Cannot isolate HV → SG6 violated | Aux feedback + redundant disconnect | S3 |
| Controller (MCU) | Software hang | Detection & reaction stop → many SGs | Independent windowed watchdog | S3 |
FMEDA — bottom-up, quantitative
The FMEDA extends the FMEA with numbers: each component’s failure rate, how its failures split between safe and dangerous, and what fraction of the dangerous ones the diagnostics catch. Every fault lands in one of a few classes, and those classes feed the hardware metrics.
| Metric | What it measures | ASIL B | ASIL C | ASIL D |
|---|---|---|---|---|
| SPFM | Single-Point Fault Metric — coverage of single-point & residual faults | ≥ 90% | ≥ 97% | ≥ 99% |
| LFM | Latent-Fault Metric — coverage of latent multi-point faults | ≥ 60% | ≥ 80% | ≥ 90% |
| PMHF | Probabilistic Metric for random HW Failures — residual dangerous rate | < 100 FIT | < 100 FIT | < 10 FIT |
1 FIT = 1 failure per 10⁹ hours. ASIL A has no hardware architectural metric target. These are the numbers a BMS hardware design must hit to claim its ASIL.
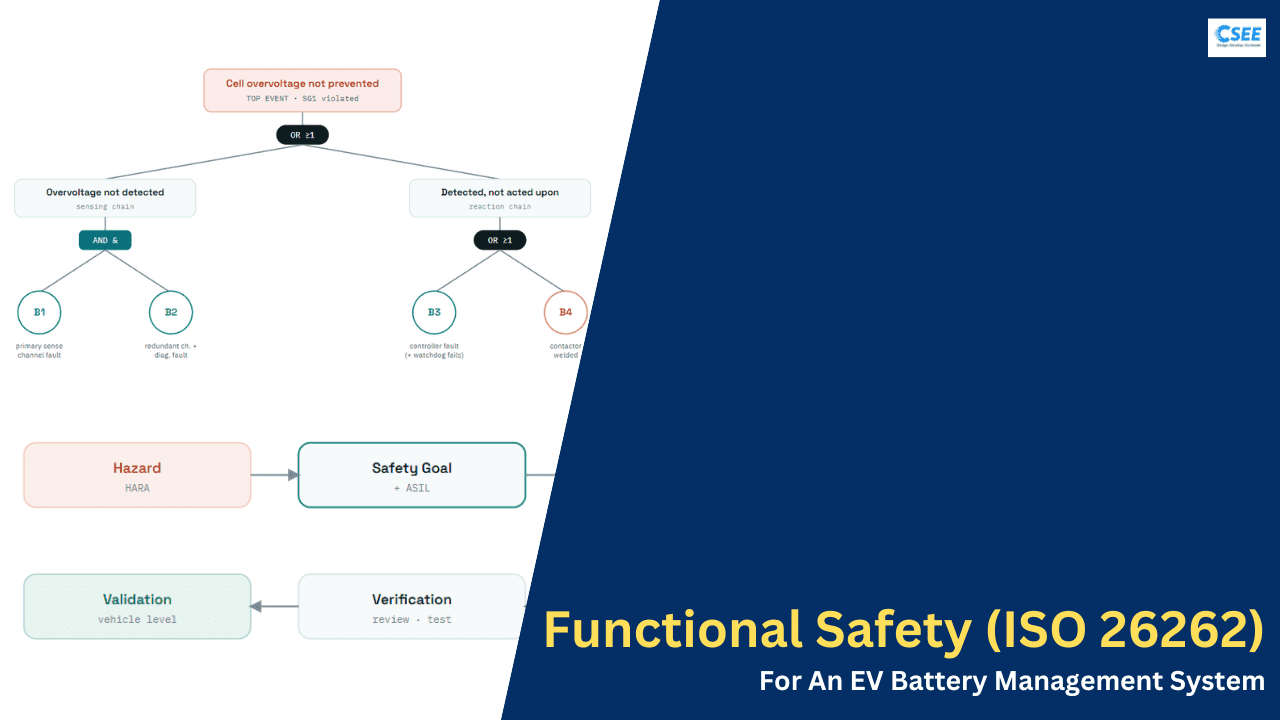
FTA — top-down, deductive
A Fault Tree Analysis starts at the hazard — the top event — and works down through logic gates to the combinations of basic faults that could cause it. An OR gate means any input alone suffices; an AND gate means several must coincide. The smallest such combinations are the minimal cut sets, and a single-element cut set is a red flag: one fault, on its own, defeating a safety goal.
The concept people find hardest — latent faults
Single-point faults are intuitive: one fault, straight to a hazard. Latent faults are subtler and are the whole reason the LFM metric exists. A latent fault is a hidden fault — usually in a safety mechanism itself — that causes no harm on its own. It only bites when a second fault arrives and finds the safety net already broken.
A failure rate of 10 FIT (the ASIL D PMHF target) means one dangerous failure per 10⁹ hours of operation — that’s roughly one failure every 11,000+ years for a single unit. The metric isn’t a promise any one part lasts that long; it’s a statistical budget across the whole fleet, which is exactly why it has to be computed, not estimated by feel.
ISO 26262-2 / -4
Verification, Validation & the Safety Case
Analysis shows the concept should be safe; this final phase shows it is — and packages the proof. Verification confirms each step was done right, validation confirms the whole item meets its safety goals in the vehicle, and the Safety Case ties the argument together. Independent confirmation measures sign it off.
Verification vs. validation
Verification asks “did we build the thing right?” at every level — requirement reviews, design analyses, and tests that each specified requirement is met (this is the right arm of the V). Validation asks “did we build the right thing?” — vehicle-level evidence that the safety goals genuinely hold, including fault-injection to confirm safe-state behaviour and timing within the FTTI.
Our hazard reaches the end: a fault-injection test deliberately forces one cell-voltage path to read false-low, and the bench confirms the cross-check flags the disagreement and the contactors open within the FTTI. That test traces back through TSR 1.1 → FSR 1.1 → SG1 → the overcharge hazard — a complete, evidenced loop. That loop, repeated for every hazard, is the Safety Case.
Traceability — the thread through everything
None of it counts unless it connects. Every hazard must trace forward to a safety goal, a requirement, a mechanism, an implementation, and a test — and every test must trace back to the hazard it ultimately protects against. Traceability is what lets you prove completeness and assess the impact of any change.
The Safety Case and confirmation measures
The Safety Case is the structured argument, backed by all of the above as evidence, that the BMS is acceptably safe. It is judged by confirmation measures whose required independence rises with ASIL — the higher the risk, the further removed the reviewer must be from the people who did the work.
| Measure | ASIL A | ASIL B | ASIL C | ASIL D |
|---|---|---|---|---|
| Confirmation review of work products | recommended | independent person | independent dept. | independent org. |
| Functional safety audit process implementation | optional | recommended | required | required |
| Functional safety assessment achieved functional safety | optional | reduced scope | required | required |
Indicative summary — the precise independence levels and applicability are defined in ISO 26262-2. The principle is constant: more risk demands more independence.
Reference
Glossary of terms & acronyms
Functional safety runs on acronyms. Here they are in one place, in plain language, roughly in the order they appear across the lifecycle.
| Term | Stands for | In plain words |
|---|---|---|
| ASIL | Automotive Safety Integrity Level | The risk class (QM, A–D) that sets how much rigour a requirement needs. |
| QM | Quality Management | “No ASIL required” — normal engineering quality is enough. |
| HARA | Hazard Analysis & Risk Assessment | The analysis that finds hazards and assigns each an ASIL. |
| S / E / C | Severity / Exposure / Controllability | The three axes that together determine the ASIL. |
| SG | Safety Goal | A top-level safety requirement — one per hazardous event. |
| FSC / FSR | Functional Safety Concept / Requirement | How a safety goal is met, in functional terms (not yet hardware). |
| TSC / TSR | Technical Safety Concept / Requirement | The same, refined onto specific hardware and software. |
| HSI | Hardware–Software Interface | The spec that pins down what each diagnostic signal means and its timing. |
| FTTI | Fault Tolerant Time Interval | Time from a fault to the hazard — the budget to detect and react. |
| FDTI | Fault Detection Time Interval | The portion of the FTTI spent detecting the fault. |
| FRTI | Fault Reaction Time Interval | The portion spent reaching the safe state after detection. |
| FMEA | Failure Mode & Effects Analysis | Bottom-up: trace each component failure to its effect. |
| FMEDA | …& Diagnostic Analysis | FMEA plus failure rates and diagnostic coverage → the hardware metrics. |
| FTA | Fault Tree Analysis | Top-down: from the hazard down to the combinations of causes. |
| SPFM | Single-Point Fault Metric | How well the design covers single-point and residual faults. |
| LFM | Latent-Fault Metric | How well diagnostics reveal hidden (latent) faults. |
| PMHF | Probabilistic Metric for random HW Failures | The residual rate of dangerous failure, in FIT. |
| FIT | Failures In Time | One failure per 10⁹ operating hours. |
| DC | Diagnostic Coverage | The fraction of a part’s dangerous failures a mechanism detects. |
| DFA | Dependent-Failure Analysis | Checks that “independent” elements really are — no common cause. |
| DIA | Development Interface Agreement | Who-does-what safety contract between customer and supplier. |
| AFE | Analog Front End | The cell-monitoring ICs that measure cell voltage and temperature. |
| HVIL | High-Voltage Interlock Loop | A loop that detects an open HV connector and triggers disconnect. |
| SoC / SoH | State of Charge / State of Health | How full the battery is / how degraded it is. |
| VCU | Vehicle Control Unit | The supervisory controller the BMS reports limits to. |
Putting it together
The whole chain, in one breath
Define the BMS precisely. Find its hazards and rate them to set ASILs and safety goals. Refine those goals into functional and then technical requirements, realised by safety mechanisms. Prove the mechanisms work with FMEA, FMEDA, and FTA. Verify each level, validate the whole in the vehicle, and assemble the Safety Case — with independent sign-off scaled to the risk. Traceability holds every link together.
Experience summary
Performed Functional Safety Analysis for a Battery Management System (BMS) in compliance with ISO 26262 — covering Item Definition, HARA, Safety Goals, FSC / FSRs, TSC / TSRs, and safety analyses including FMEA, FMEDA, and FTA.
Identified hazards related to overvoltage, undervoltage, overcurrent, overtemperature, and contactor control, and defined safety mechanisms including redundant sensing, diagnostic monitoring, plausibility checks, and watchdog supervision.
Supported ASIL compliance, safety verification, validation, and requirements traceability across the safety lifecycle.