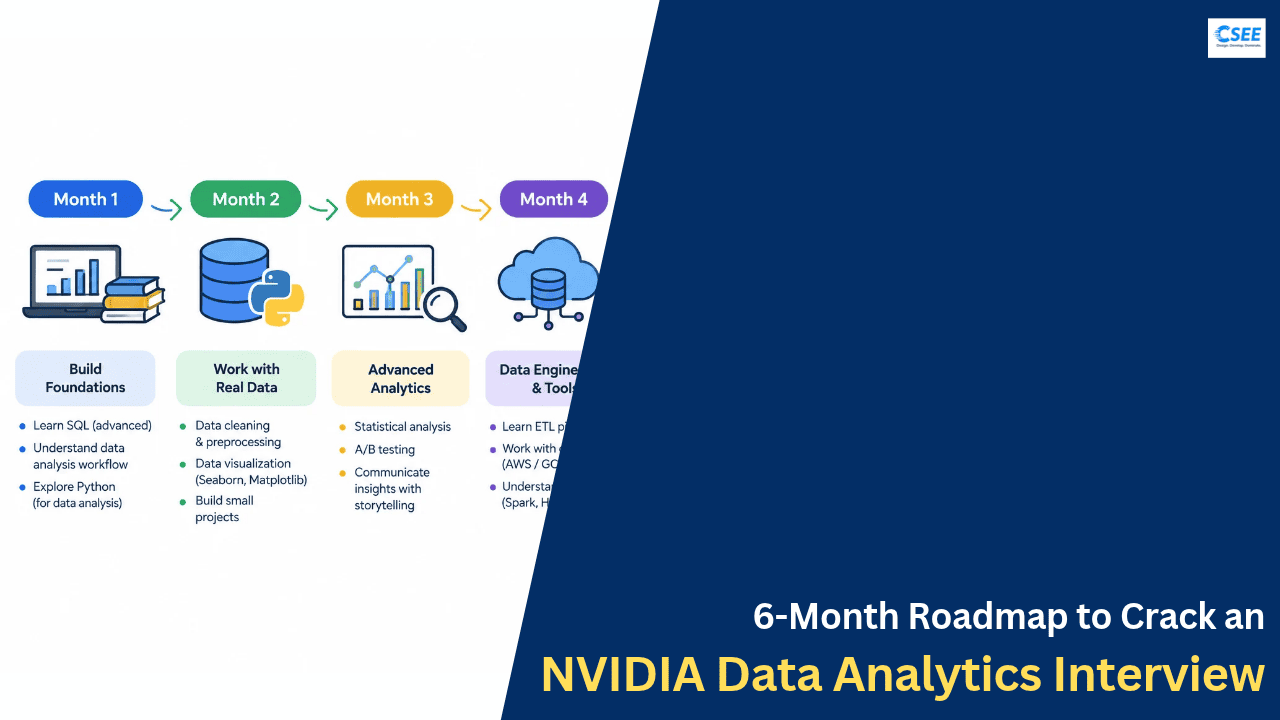
6-Month Roadmap to Crack an NVIDIA Data Analytics Interview
A week-by-week plan covering SQL, Python, statistics, product and business thinking, dashboards, stories for behavioral rounds, and mock interviews. It is built for someone with some analytics exposure who wants to be ready in 24 weeks.
1. Understand the role
NVIDIA is known for GPUs, but its business now spans data center, gaming, professional visualization, automotive and software platforms. Analysts there support decisions about supply and demand, product performance, customer adoption, developer ecosystems, sales operations, and internal efficiency. Data is large, technical and often tied to hardware or software telemetry.
That means interviewers tend to value three things beyond generic analytics skills: comfort with technical, high-volume data; clear reasoning about business impact; and the ability to explain findings to engineers and executives alike.
| Typical responsibility | What it looks like day to day | Skill it tests |
|---|---|---|
| Reporting and dashboards | Weekly KPI views for sales, supply or product teams | SQL, BI tools, metric design |
| Ad hoc analysis | “Why did demand dip in one region?” | Structured thinking, Python or SQL |
| Experiments and measurement | Evaluating a software feature or program change | Statistics, A/B testing |
| Data quality and pipelines | Validating sources, fixing mismatches | Data modeling, attention to detail |
| Stakeholder communication | Presenting to managers and engineers | Storytelling, prioritization |
2. The big picture
| Month | Theme | Weekly hours | Main output |
|---|---|---|---|
| 1 | Foundations and diagnosis | 10–12 | Skill baseline, study system, SQL basics |
| 2 | SQL mastery | 12–14 | 150 solved SQL problems, query templates |
| 3 | Python and statistics | 12–14 | pandas fluency, A/B testing notes |
| 4 | Business and product analytics | 12–14 | 20 practiced case answers |
| 5 | Portfolio, BI and resume | 12–14 | 2 projects, dashboard, tailored resume |
| 6 | Mock interviews and applications | 14–16 | 10 mocks, applications, referrals |
If you work full time, 10 to 14 hours a week is realistic: about 1.5 hours on weekdays and 3 hours on each weekend day. Consistency beats intensity.
3. How NVIDIA-style interviews usually flow
| Round | Focus | How to win it |
|---|---|---|
| Recruiter | Background, location, salary range, motivation | Prepare a 60-second pitch and a specific “why NVIDIA” answer |
| Technical screen | SQL queries, basic Python, metrics | Think aloud, state assumptions, test with a tiny example |
| Hiring manager | Past projects, ownership, team fit | Use numbers and the STAR format |
| Panel loop | Case study, deeper SQL, statistics, behavioral | Stay structured, ask clarifying questions, summarize often |
4. Skill map: what to learn and how deep
| Area | Must know | Good to know |
|---|---|---|
| SQL | Joins, GROUP BY, window functions, CTEs, subqueries, date handling, NULLs | Query optimization, indexes, recursive CTEs |
| Python | pandas, groupby, merge, cleaning, basic plotting | NumPy, scipy, simple automation |
| Statistics | Distributions, hypothesis tests, p-values, confidence intervals, sampling bias | Power analysis, regression, Bayesian basics |
| Metrics | KPI trees, funnels, cohorts, retention, root-cause analysis | Forecasting, segmentation |
| BI | One of Tableau or Power BI, clear chart choice | Data modeling for dashboards |
| Domain | What GPUs, AI and data center products do, at a high level | Supply chain and semiconductor basics |
5. Month 1: Foundations and diagnosis (weeks 1–4)
The goal is to know where you stand and to build a system you can sustain for six months.
Week 1: Baseline
- Read three or four NVIDIA data analytics job descriptions and list repeated keywords.
- Rate yourself 1 to 5 on each skill in the map above.
- Do one timed SQL set of five easy-to-medium questions without help. Note your weak spots.
- Create a tracker with columns for date, topic, hours, problems solved and confidence.
Week 2: Environment and habits
- Install a local database such as SQLite or PostgreSQL and a Python environment with Jupyter.
- Pick one practice platform for SQL problems and stick with it.
- Set a fixed study schedule and protect it in your calendar.
Weeks 3–4: SQL fundamentals
- SELECT, WHERE, ORDER BY, LIMIT, DISTINCT, aliases.
- INNER, LEFT, RIGHT and FULL joins, with a drawing of each.
- GROUP BY, HAVING and aggregate functions. Practice the difference between WHERE and HAVING.
- Solve 30 easy problems by the end of the month.
6. Month 2: SQL mastery (weeks 5–8)
SQL is the most reliable filter in analytics interviews. Spend this month making it automatic.
| Week | Topic | Practice target |
|---|---|---|
| 5 | Subqueries, CTEs, CASE WHEN, NULL handling | 30 problems |
| 6 | Window functions: ROW_NUMBER, RANK, DENSE_RANK, LAG, LEAD, running totals | 35 problems |
| 7 | Date and time logic, cohorts, retention, rolling averages | 30 problems |
| 8 | Mixed timed sets, optimization, explaining query plans | 4 timed sessions of 45 minutes |
Patterns worth memorizing
Second highest value per group, using a window function:
WITH ranked AS (
  SELECT dept, employee, salary,
         DENSE_RANK() OVER (PARTITION BY dept ORDER BY salary DESC) AS rnk
  FROM employees
)
SELECT dept, employee, salary FROM ranked WHERE rnk = 2;
Month-over-month change:
SELECT month, revenue,
       revenue - LAG(revenue) OVER (ORDER BY month) AS change
FROM monthly_revenue;
Common SQL mistakes interviewers notice
- Forgetting that NULL does not equal NULL.
- Joining before aggregating, which duplicates rows and inflates sums.
- Using COUNT(*) when COUNT(DISTINCT user_id) is needed.
- Not checking edge cases such as ties, empty groups and time zones.
When you answer, restate the question, name the grain of the output (one row per what?), write the query in steps, and test it against a three-row example out loud.
7. Month 3: Python and statistics (weeks 9–12)
Python for analysts
You rarely need advanced software engineering. You need to load, clean, reshape, summarize and visualize data quickly and correctly.
| Task | pandas tool | SQL equivalent |
|---|---|---|
| Filter rows | df[df.x > 5] | WHERE |
| Aggregate | df.groupby("k").agg(...) | GROUP BY |
| Combine tables | pd.merge(a, b, on="id") | JOIN |
| Rank within group | df.groupby("k")["v"].rank() | RANK() OVER |
| Missing values | fillna, dropna | COALESCE |
| Reshape | pivot_table, melt | CASE + GROUP BY |
- Week 9: pandas basics, indexing, cleaning, dates.
- Week 10: groupby, merge, pivot, apply, and 15 data-cleaning exercises.
- Week 11: visualization with clear charts, plus a first mini analysis end to end.
- Week 12: timed pandas problems and translating between SQL and pandas.
Statistics you must be able to explain simply
| Concept | Plain-language answer |
|---|---|
| p-value | How surprising the data would be if there were really no effect. It is not the chance the hypothesis is true. |
| Confidence interval | A range of plausible values for the true effect, given the data and method. |
| Type I error | Declaring an effect when none exists (false positive). |
| Type II error | Missing a real effect (false negative). Linked to statistical power. |
| Sample size | Depends on baseline rate, minimum detectable effect, variance, power and significance level. |
| Simpson’s paradox | A trend in groups reverses when groups are combined. Always segment before concluding. |
| Selection bias | The sample differs systematically from the population you care about. |
| Correlation vs causation | Association alone does not show cause. Experiments or careful design are needed. |
8. Month 4: Business and product analytics (weeks 13–16)
This is where many candidates lose points. Interviewers want to see that you turn vague questions into measurable ones and recommend actions.
The five-step answer
- Clarify. What decision depends on this? Who is the audience? What time frame?
- Define metrics. Pick one primary metric and two or three guardrails.
- Decompose. Split the metric into drivers, for example revenue = units × price, then by region, product and customer type.
- Diagnose. Check data quality first, then external factors, then internal changes, then segments.
- Recommend. State the action, expected impact, risks and how you will measure success.
| Week | Focus | Practice |
|---|---|---|
| 13 | KPI trees, funnels, cohorts | Build trees for 5 products you know |
| 14 | Root-cause analysis for metric drops and spikes | 6 written cases |
| 15 | Experiment design and trade-offs | 5 A/B test designs |
| 16 | NVIDIA-flavored cases and domain reading | 9 cases, spoken aloud |
Sample practice cases
- Usage of a developer software toolkit dropped 12% week over week. How do you investigate?
- How would you measure the success of a new GPU cloud trial program?
- Sales are flat, but order volume is rising. What might explain it?
- Which metrics would you track to monitor the health of a developer community?
- Design a dashboard for a supply planning team.
Domain reading
Spend two hours a week reading NVIDIA’s public earnings summaries, product announcements and blog posts. You are not trying to become an engineer. You are trying to speak naturally about data center demand, AI workloads, gaming, software ecosystems and supply constraints, and to connect them to the metrics you would track.
9. Month 5: Portfolio, BI tools and resume (weeks 17–20)
Two projects that matter
| Project | Idea | What it proves |
|---|---|---|
| Hardware or tech market analysis | Use public datasets on GPU benchmarks, prices or tech adoption; analyze trends and segment demand | Python, SQL, domain interest, storytelling |
| Experiment or funnel analysis | Simulate or use a public A/B dataset; run tests, report effect sizes and a recommendation | Statistics, decision-making |
Each project should have a clear question, a cleaned dataset, a short method section, three insights with numbers, and a recommendation. Host it in a tidy repository or document, with no clutter.
Dashboard skills
- Pick Tableau or Power BI and build one dashboard with a clear top-level KPI row, trend charts and filters.
- Use the right chart: lines for time, bars for comparison, tables only for lookup.
- Limit colors, label directly, and keep each page focused on one decision.
Resume rewrite
| Weak bullet | Stronger bullet |
|---|---|
| Built dashboards for sales team | Built a sales dashboard used by 40 managers, cutting weekly reporting time by 6 hours |
| Analyzed customer data | Analyzed 2M customer records with SQL to find a churn driver, leading to a 4% retention gain |
| Worked on A/B testing | Designed and analyzed 8 A/B tests; 3 shipped, adding an estimated 2% conversion |
Use your own true numbers, never invented ones. Mirror keywords from the job description where they honestly apply. Keep to one page unless you have a long career.
10. Month 6: Mocks, behavioral stories and applications (weeks 21–24)
Behavioral preparation
Prepare eight stories that you can bend to many questions. Use STAR: Situation, Task, Action, Result. Spend most of your time on Action and Result, and include what you learned.
| Story theme | Typical question |
|---|---|
| Impact with data | Tell me about an analysis that changed a decision. |
| Conflict or disagreement | Describe a time you disagreed with a stakeholder. |
| Mistake or failure | Tell me about an error in your analysis. |
| Ambiguity | How did you handle a vague request? |
| Speed and pressure | Describe a tight deadline. |
| Learning fast | When did you learn a new tool or domain quickly? |
| Collaboration | How did you work with engineers or other teams? |
| Initiative | When did you start something nobody asked for? |
Intellectual honesty, speed, teamwork and taking on hard problems are themes technology companies like NVIDIA tend to prize. Show them through real examples, not slogans.
The four-week finish
| Week | Priority | Actions |
|---|---|---|
| 21 | Applications and referrals | Apply to 10 or more roles, message alumni and connections, tailor the resume |
| 22 | Technical mocks | 3 SQL mocks, 2 Python mocks, review mistakes |
| 23 | Case and behavioral mocks | 3 case mocks, 3 behavioral mocks with feedback |
| 24 | Polish and rest | Light review, sleep, logistics, questions to ask |
11. Full 24-week calendar
| Weeks | Primary focus | Secondary focus |
|---|---|---|
| 1–2 | Baseline, setup | Job description analysis |
| 3–4 | SQL basics and joins | Excel refresh |
| 5–6 | CTEs, windows | Statistics intro |
| 7–8 | Dates, cohorts, timed sets | Python setup |
| 9–10 | pandas core | SQL maintenance |
| 11–12 | Statistics and A/B testing | Visualization |
| 13–14 | KPI trees and root cause | Domain reading |
| 15–16 | Experiment design, cases | SQL timed sets |
| 17–18 | Project 1 | BI tool |
| 19–20 | Project 2, resume | Dashboard polish |
| 21–22 | Applications, technical mocks | Stories |
| 23–24 | Full mock loops | Rest and logistics |
12. A weekly rhythm that works
13. Mock interview routine
- Do at least ten mocks in total, spread across technical, case and behavioral formats.
- Record yourself once a week. Watch for rambling, filler words and silence.
- After each mock, write down three fixes and one thing you did well.
- Practice explaining the same answer in 30 seconds, 2 minutes and 5 minutes.
Questions you should ask them
- What are the biggest decisions this team supports with data?
- What does success look like in the first six months?
- Which tools and data sources does the team use?
- How do analysts and engineers collaborate here?
14. Mistakes that cost candidates offers
| Mistake | Better approach |
|---|---|
| Jumping straight into code | Clarify, state assumptions, then write |
| Silent thinking | Narrate your reasoning |
| Metrics without a goal | Tie every metric to a decision |
| Memorizing answers | Learn patterns and adapt them |
| Vague stories | Add numbers, your role and the outcome |
| Generic “why NVIDIA” | Name specific products, data problems and teams that interest you |
| Ignoring rest | Sleep and breaks improve recall and calm |
15. Final week and interview day checklist
- Review your SQL pattern notes and one page of statistics definitions.
- Rehearse your 60-second introduction and three top stories.
- Re-read the job description and your resume line by line.
- Test your camera, microphone, internet and coding environment.
- Prepare four questions for the interviewers.
- Sleep well, eat, and arrive early or log in ten minutes before.
- Send a short thank-you note within 24 hours.
16. Progress scorecard
| Checkpoint | Target by then |
|---|---|
| End of month 1 | 30 easy SQL problems, tracker running |
| End of month 2 | 150 SQL problems, windows comfortable, timed medium in 20 minutes |
| End of month 3 | Explain A/B testing end to end, solve pandas tasks without lookup |
| End of month 4 | 20 cases practiced, reusable framework |
| End of month 5 | Two projects, one dashboard, polished resume |
| End of month 6 | 10 mocks, applications sent, stories ready |
17. If you have less or more time
| Situation | Adjustment |
|---|---|
| Only 3 months | Merge months 1–2, skip the second project, start applying in week 6 |
| Already strong at SQL | Shift 3 weeks to cases and statistics |
| Career switcher | Add a month on fundamentals and build more portfolio work |
| Student or new graduate | Emphasize projects, internships and campus referrals |