EV Fundamentals / Tutorial 01
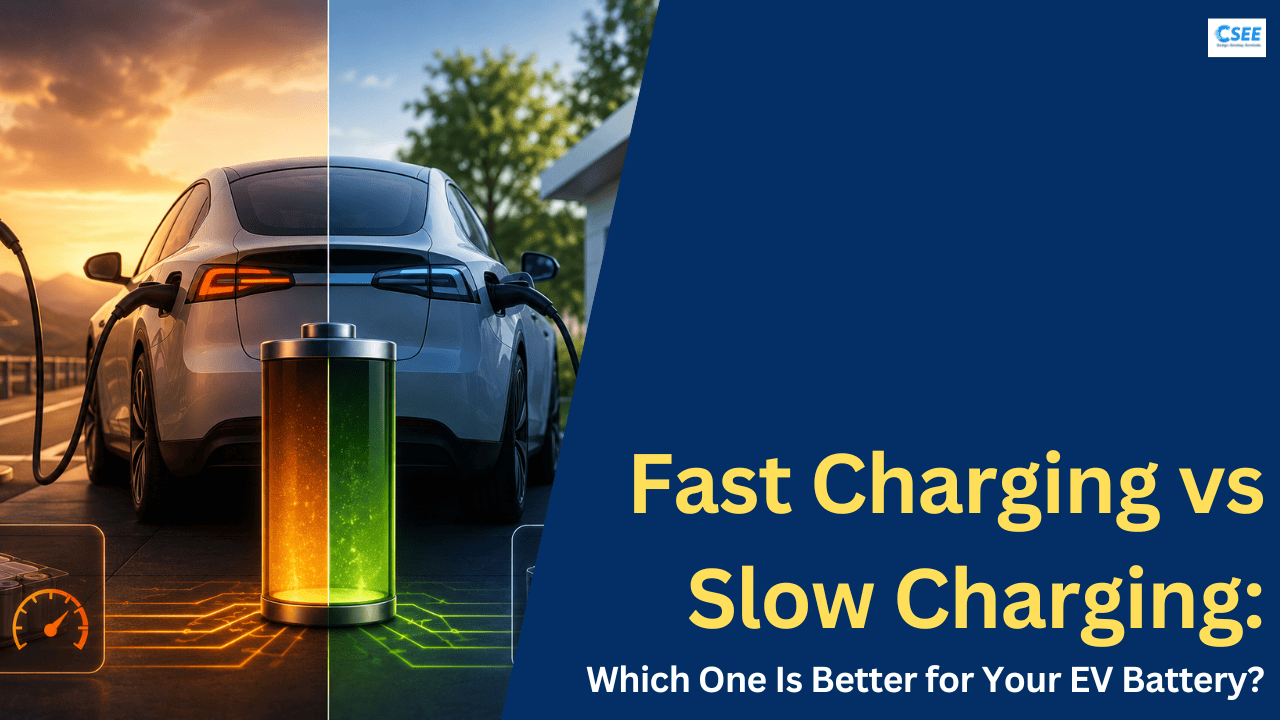
Fast ChargingversusSlow Charging
What actually happens inside an electric car when you plug it in — why one plug takes twelve hours and another takes eighteen minutes, and what that difference costs your battery.
01 — The questionWhy this distinction matters more than any other EV spec
When people shop for a petrol or diesel car, refuelling never enters the conversation. Every pump on every forecourt delivers roughly the same thing at roughly the same rate, and the whole transaction is over in four minutes. There is nothing to learn, nothing to plan, and no way to do it wrong.
Electric cars broke that assumption. An EV can be refilled from a battered three-pin socket in a garage, from a wall-mounted box that a licensed electrician bolted next to the front door, from a pillar in a supermarket car park, or from a refrigerated, liquid-cooled cable at a motorway plaza that pushes more power than an entire street of houses draws. The slowest of those options and the fastest of them differ by a factor of roughly one hundred and fifty. Same car, same battery, same connector standard in many cases — completely different experience.
That single fact reshapes everything downstream. It determines whether an EV fits your life, how much you pay per kilometre, how long your battery lasts, how you plan a long journey, and whether the car is a quiet convenience or a recurring source of anxiety. It is the most consequential thing to understand about electric vehicles, and it is also the thing most often reduced to a marketing number on a spec sheet.
This tutorial takes the number apart. We start with the physics, because almost every practical rule about charging falls straight out of the physics once you can see it. Then we build up through the hardware, the battery chemistry, the thermal engineering, the real-world timings, the cost arithmetic, and finally the habits that actually keep a battery healthy. By the end you should be able to look at any charger, any car, and any journey, and predict roughly what will happen — and know when the fast option is worth it and when it is simply an expensive way to hurt your car.
02 — FoundationsFour numbers that explain everything
You cannot reason about charging without four quantities. They are not difficult, but they are constantly confused with one another — including by manufacturers — so it is worth ten minutes to nail them down properly.
Voltage (volts, V) — the pressure
Voltage is electrical pressure: how hard the electrons are being pushed. A household socket in Europe or India sits at around 230 V. North American sockets are 120 V. An EV traction battery — the big one under the floor, not the little 12 V one that runs the lights — typically sits somewhere between 350 V and 450 V in what the industry calls a “400-volt architecture”, or between 700 V and 900 V in an “800-volt architecture”. Voltage on its own tells you nothing about speed.
Current (amperes, A) — the flow
Current is how many electrons are moving per second. This is the number that heats things up, because resistance in a cable turns current into heat at a rate proportional to the square of the current. Double the current and you quadruple the heat. That single relationship, written P_loss = I² × R, is quietly responsible for most of the design decisions in this entire article.
Power (kilowatts, kW) — the rate
Power is voltage multiplied by current, and it is the rate at which energy moves. Power = Volts × Amps. A 230 V socket delivering 10 A is moving 2,300 watts, or 2.3 kW. A DC charger pushing 400 V at 500 A is moving 200,000 watts, or 200 kW. Power is the “speed” of charging. When someone says a charger is “50 kW” or “150 kW”, they are describing a rate, exactly like litres per minute at a fuel pump.
Energy (kilowatt-hours, kWh) — the amount
Energy is power sustained over time. A battery’s capacity is measured in kWh, and this is the quantity you actually buy from an electricity retailer. A 60 kWh battery holds 60 kilowatt-hours. Charging it at 6 kW takes roughly ten hours; charging it at 120 kW would, if the rate could be held, take half an hour.
Hours ≈ Energy needed (kWh) ÷ Charging power (kW). If you need 40 kWh and the charger gives 7 kW, that is roughly 5.7 hours. This estimate is honest for slow charging and increasingly optimistic for fast charging — and section 07 explains exactly why.
Two consequences follow immediately, and they are worth stating plainly because they resolve a great deal of confusion.
First: you can raise power either by raising voltage or by raising current, and those two routes are not equivalent. Raising current means thicker, heavier, hotter cables. Raising voltage means the same power flows through thinner, cooler cables, but every component in the chain — inverter, motor, compressor, wiring insulation — has to be rated for the higher pressure. This is the entire argument behind 800-volt cars, and we return to it in section 14.
Second: a battery’s capacity in kWh has nothing to do with how fast it can be filled. A big battery is not inherently a fast-charging battery. What determines speed is the cell chemistry, the cooling system, and the power electronics — and, crucially, whichever component in the chain is the weakest link.
03 — The fork in the roadAC and DC: the real dividing line
Here is the single most important structural fact in EV charging, and the one that most tutorials skip: “slow” and “fast” are not two settings on the same system. They are two physically different systems that happen to share a socket on the side of your car.
Batteries store and release direct current (DC): electrons flowing steadily in one direction. The electricity grid, however, distributes alternating current (AC), which reverses direction fifty or sixty times a second, because AC is far cheaper to transmit over long distances and trivially easy to step up and down in voltage with transformers. So somewhere between the grid and the battery, AC must be converted into DC. The question is simply where.
Route A — AC charging: the conversion happens inside the car
When you plug into a household socket or a home wallbox, what travels down the cable is ordinary AC mains electricity. The wallbox is not really a charger at all; it is a smart, safety-checked switch that negotiates with the car, confirms the earth connection is sound, tells the car how much current the circuit can safely supply, and then simply lets mains through. The actual charger — the device doing the AC-to-DC conversion — lives inside the vehicle. It is called the on-board charger, or OBC.
The on-board charger is the bottleneck of the entire AC route. It is a box of power electronics that has to be light, compact, cheap, and cooled within an already crowded engine bay. Manufacturers therefore size it modestly: 3.3 kW, 7.4 kW, and 11 kW are the common ratings, with 22 kW appearing on some European models. Plugging a car with a 7.4 kW on-board charger into a 22 kW AC post gets you 7.4 kW. Not 22. The post is willing; the car is not.
Route B — DC charging: the conversion happens in the pillar
A DC fast charger takes the opposite approach. It does the AC-to-DC conversion inside its own cabinet, where there is space for large transformers, big rectifier stacks, and serious liquid cooling. It then delivers DC straight to the battery, bypassing the on-board charger entirely. The car’s role shrinks to a supervisory one: its battery management system tells the pillar, many times per second, exactly what voltage and current it is prepared to accept, and the pillar obeys.
Because the conversion hardware is no longer constrained by weight, cost, or engine-bay space, it can be enormous. This is the whole reason DC charging is fast. It is not that DC electricity is inherently quicker — it is that moving the converter out of the car removes the constraint that was limiting it.
“My car charges at 11 kW, so it’s an 11 kW car.” No. That is only its AC ceiling. The same car might accept 150 kW on DC. The two figures come from completely separate hardware paths and should always be quoted separately.
04 — The hardwareCharging levels, from trickle to ultra-rapid
The industry sorts charging into levels. The naming is regional and slightly inconsistent, but the underlying tiers are universal. What follows is the practical map.
Level 1 — the domestic socket (1.4 to 2.4 kW)
This is a standard household outlet with the cable that came in the boot. In North America it is a 120 V socket delivering around 12 A, giving roughly 1.4 kW. In Europe, India, Australia and most of Asia it is a 230 V socket at 10 A, giving about 2.3 kW. It requires no installation and no electrician. It is also so slow that it is best thought of as a trickle rather than a charge: it adds something in the region of 6 to 13 km of range per hour.
Level 1 is genuinely useful for two groups of people. Plug-in hybrid owners, whose batteries are typically 8 to 18 kWh, can fully replenish overnight. And EV drivers with short, predictable commutes — under about 40 km a day — can keep pace indefinitely simply by plugging in every night. For everyone else it is an emergency fallback.
Level 1 charging draws near-maximum current continuously for many hours, which is unlike almost any other domestic appliance. Never use an extension lead, a multi-way adapter, or a coiled reel. Have an electrician confirm the circuit and the socket are in good condition. Warm plugs, discoloured faceplates, and a smell of hot plastic mean stop immediately.
Level 2 — the wallbox (3.7 to 22 kW)
This is the workhorse of EV ownership and where the great majority of all charging happens worldwide. A wallbox is installed on a dedicated circuit with its own breaker and residual-current protection. Single-phase installations, common in the UK and in most homes in India and North America, typically deliver 7.4 kW (230 V at 32 A) or 7.7 kW (240 V at 32 A). Three-phase supply, common in continental Europe and in Indian commercial premises, unlocks 11 kW or 22 kW.
At 7.4 kW a typical EV gains roughly 40 km of range per hour. Plugged in at 7 pm and unplugged at 7 am, that is 480 km added overnight — more than most batteries hold. This is the crucial insight that reframes the whole slow-versus-fast debate: slow charging is not slow in any way that matters, because it runs while you sleep. The relevant measure is not power, it is whether the car is full when you need it.
Level 3 / DC fast — the pillar (50 to 150 kW)
The first widely deployed DC standard sat at 50 kW, and a great many of those units are still in service. They will take a typical modern EV from 20% to 80% in roughly 50 to 70 minutes. The generation that followed pushes 100 to 150 kW and roughly halves that.
Ultra-rapid DC — 150 to 400 kW
These are liquid-cooled installations, usually at motorway service areas and dedicated charging hubs. The cable is thin and light despite the current, because coolant circulates through it. On a car engineered to accept it, 10% to 80% can take 15 to 20 minutes. On a car that cannot, the pillar politely delivers whatever the car will take and no more — you pay for the location, not the headline number.
Megawatt charging — 1,000 kW and beyond
Standardised primarily for heavy trucks and buses, where a battery might be 600 kWh and downtime is expensive. Not a passenger-car technology, but the engineering developed there tends to trickle down.
| Tier | Current | Typical power | Range added / hour* | 0–100% on a 60 kWh car | Where you find it |
|---|---|---|---|---|---|
| Level 1 | AC | 1.4–2.4 kW | 6–13 km | 26–43 hours | Any domestic socket |
| Level 2, single phase | AC | 3.7–7.7 kW | 20–40 km | 8–16 hours | Home wallbox, workplace |
| Level 2, three phase | AC | 11–22 kW | 60–120 km | 3–6 hours | Public kerbside, offices, malls |
| DC fast | DC | 50 kW | ~250 km | ~1.5 hours to 80% | Highways, older networks |
| DC rapid | DC | 100–150 kW | 500–750 km | ~35 min to 80% | Motorway services |
| DC ultra-rapid | DC | 150–400 kW | 750–1,500 km | 15–20 min to 80% | Dedicated charging hubs |
| Megawatt | DC | 1,000 kW+ | n/a | n/a | Freight depots, bus routes |
↔ swipe the table sideways · *assumes ~16 kWh/100 km efficiency
Connectors: the plugs themselves
Connector standards are a regional patchwork, though they are converging. The key thing to understand is that most modern connectors are combined: the same physical socket handles both AC and DC, with extra pins for the DC path.
| Connector | Handles | Where dominant | Notes |
|---|---|---|---|
| Type 1 (J1772) | AC only, up to ~7.7 kW | North America, Japan (legacy) | Single-phase only |
| Type 2 (Mennekes) | AC, up to 22 kW (43 kW rare) | Europe, India, Australia | Supports three phase |
| CCS1 | Type 1 + two DC pins | North America | Up to ~350 kW |
| CCS2 | Type 2 + two DC pins | Europe, India, most of the world | Up to ~350 kW; India’s default |
| CHAdeMO | DC only, separate socket | Japan; legacy elsewhere | Declining outside Japan |
| NACS / SAE J3400 | AC and DC in one small plug | North America | Adopted industry-wide from 2025 |
| GB/T | Separate AC and DC sockets | China | Largest network by count |
↔ swipe the table sideways
05 — The honest metricC-rate: comparing charging speed across any battery
Kilowatts alone are misleading, because 100 kW into a small battery is a violent event and 100 kW into a very large one is gentle. The measure that removes battery size from the equation is the C-rate.
C-rate is charging power divided by battery capacity. A 60 kWh battery charging at 60 kW is charging at 1C — one full capacity per hour. The same battery at 120 kW is at 2C. At 6 kW it is at 0.1C.
C-rate = charging power (kW) ÷ battery capacity (kWh). It expresses stress on the cells, not just speed. Two cars pulling identical kilowatts can be experiencing very different levels of strain.
| Vehicle | Battery | Power drawn | C-rate | Stress on cells |
|---|---|---|---|---|
| Small city EV | 30 kWh | 50 kW (its limit) | 1.7C | High |
| Mid-size hatchback | 60 kWh | 120 kW | 2.0C | High |
| Large SUV | 100 kWh | 150 kW | 1.5C | Moderate |
| Same SUV, home wallbox | 100 kWh | 7.4 kW | 0.07C | Negligible |
↔ swipe the table sideways
The last row is the important one. Home charging is not merely “less fast” than DC charging — it is roughly twenty to thirty times gentler in terms of cell stress. That is not a difference of degree. It is a different regime of operation, and it explains why the battery-health advice in section 12 is as lopsided as it is.
06 — Inside the cellWhat charging actually does at the atomic scale
To understand why fast charging has costs, you have to look at what a lithium-ion cell is doing while it fills. This section is the conceptual heart of the tutorial; everything practical afterwards follows from it.
The architecture of a cell
A lithium-ion cell has four functional parts:
- The cathode (positive electrode), a layered metal-oxide or phosphate structure — nickel-manganese-cobalt (NMC) and lithium-iron-phosphate (LFP) are the two dominant families.
- The anode (negative electrode), almost always graphite, sometimes with silicon added. Graphite is a stack of carbon sheets with gaps between them.
- The electrolyte, a lithium-salt solution that lets lithium ions swim between the electrodes but blocks electrons.
- The separator, a microporous plastic film that physically keeps the electrodes apart while letting ions through.
What happens when you charge
Charging drives lithium ions out of the cathode, across the electrolyte, and into the anode, where they slot into the gaps between graphite sheets. This slotting-in is called intercalation, and it is the entire mechanism of a lithium-ion battery. Discharging reverses it.
Intercalation is not instantaneous. Each ion has to arrive at the graphite surface, shed the shell of solvent molecules clinging to it, pass through a thin protective film on the anode surface, and then diffuse sideways into the graphite structure to find an empty site. That final diffusion step is the slow one. Think of a car park: cars arrive at the entrance quickly, but finding a space and parking takes time, and if cars arrive faster than they can park, they queue at the gate.
Lithium plating: what goes wrong when you rush
When charging current is high, ions arrive at the anode surface faster than they can intercalate. They pile up. Once the local concentration is high enough — and once the electrical potential at the surface drops below a critical threshold — the ions stop waiting for a parking space and instead accept an electron directly at the surface, becoming metallic lithium plated onto the graphite.
This is bad in three distinct ways:
- Capacity loss. Some plated lithium reacts irreversibly with the electrolyte and is permanently removed from circulation. Every plating event shaves a little capacity off the battery, forever.
- Resistance increase. The plated layer and its reaction products thicken the surface film, making future charging harder and generating more heat — a self-reinforcing loop.
- Dendrites. Plated lithium tends to grow in needle-like structures. If a dendrite grows long enough to pierce the separator, it creates an internal short circuit. This is the failure mode behind thermal runaway.
Two conditions make plating dramatically more likely: cold cells (diffusion inside graphite slows sharply as temperature falls) and a high state of charge (the graphite is already crowded, so free sites are scarce). Combine cold and nearly-full and high current, and you have the worst case. Every rule you have ever heard about EV charging traces back to avoiding that combination.
07 — The curveWhy a “150 kW charger” almost never gives you 150 kW
If you have only ever charged at home, you may assume charging is a steady process: plug in, power flows at a constant rate, done. On AC that is essentially true. On DC it is emphatically not.
DC charging follows a charging curve — a power-versus-state-of-charge profile determined by the car’s battery management system (BMS), not by the charger. The pillar is a servant. The BMS decides, and the shape of that decision looks roughly like a mountain with a long descending ridge.
Reading the curve
- 0–10%: often slightly reduced, as the BMS confirms cell balance and temperature before committing.
- 10–30%: the peak. The anode is nearly empty, so intercalation sites are abundant and ions have somewhere to go. This is where the headline number appears, if it appears at all.
- 30–55%: the first taper. Sites are filling; the BMS backs off to keep the anode potential safely above the plating threshold.
- 55–80%: a steeper taper, usually to somewhere between a third and a half of peak power.
- 80–100%: the long tail. Power collapses, often to under 20 kW, and the last 20% frequently takes as long as the first 80%.
“Stop at 80%” is not superstition and it is not primarily about battery health. It is about time. Beyond 80% the charger is delivering so little power that you are paying parking rates for range you could add in three minutes at the next stop. On a road trip, two stops from 10% to 65% is almost always faster overall than one stop from 10% to 100%.
Average power is the number that matters
Manufacturers quote peak power because it is the biggest number available. The useful figure is average power over the 10–80% window, which you can compute yourself: take 70% of the battery capacity and divide by the quoted 10–80% time in hours.
| Car profile | Battery | Peak DC | 10–80% time | Energy added | Average power | Peak actually delivered |
|---|---|---|---|---|---|---|
| Budget hatchback | 40 kWh | 50 kW | 45 min | 28 kWh | 37 kW | 74% |
| Mainstream 400 V | 60 kWh | 150 kW | 28 min | 42 kWh | 90 kW | 60% |
| Premium 400 V | 82 kWh | 170 kW | 30 min | 57 kWh | 115 kW | 68% |
| 800 V performance | 77 kWh | 240 kW | 18 min | 54 kWh | 180 kW | 75% |
| 800 V large SUV | 100 kWh | 270 kW | 22 min | 70 kWh | 191 kW | 71% |
↔ swipe the table sideways · figures are representative, not model-specific
Notice that a car with a lower peak but a flatter curve can beat a car with a spectacular peak that collapses immediately. Charging-curve flatness is a genuine engineering achievement and is more valuable than a headline number. When comparing cars, ask for the 10–80% time, never the peak.
08 — HeatThe physics tax on every fast charge
Every part of the charging chain has electrical resistance, and every ampere passing through resistance produces heat. Because the loss goes as the square of current, heat is the defining constraint of fast charging.
Consider a cell with 2 milliohms of internal resistance. At 50 A the heat generated is 5 watts. At 500 A — ten times the current — it is 500 watts, a hundred times more. Multiply by a few hundred cells in a sealed pack and you have a serious thermal event that must be managed in real time.
Where the heat comes from
- Ohmic heating in the cells — the dominant source, scaling with current squared.
- Entropic heat — the intercalation reaction itself absorbs or releases heat depending on state of charge.
- Cable and connector losses — why ultra-rapid cables carry coolant.
- Power electronics losses — rectifier and inverter inefficiency, mostly in the pillar on DC.
The Goldilocks band
Lithium-ion cells accept charge best between roughly 20 °C and 40 °C. Below that, ion mobility in the electrolyte and diffusion within graphite both slow down, raising plating risk. Above it, the electrolyte begins to decompose and the protective film on the anode thickens irreversibly, permanently increasing resistance. The BMS therefore polices temperature aggressively, and its primary tool is simply reducing power.
Thermal management systems
How a car handles this heat is one of the biggest differentiators between models, and it is rarely advertised.
| System | How it works | DC capability | Typical fitment |
|---|---|---|---|
| Passive | Ambient air over the case; no active control | Poor — heavy derating, often permanent after repeated use | Early and very low-cost EVs |
| Forced air | Cabin or ambient air blown through ducts | Limited; struggles in hot climates | Older small EVs, some two-wheelers |
| Liquid cooling | Glycol coolant through plates between modules | Good; supports sustained 100–200 kW | The mainstream standard today |
| Refrigerant-coupled liquid | Coolant loop tied into the A/C circuit; can chill below ambient | Excellent; supports 250 kW+ and repeat sessions | Performance and premium EVs |
| Immersion | Cells submerged in dielectric fluid | Excellent, very uniform | Motorsport; emerging in production |
| Heat pump + pack heater | Adds the ability to warm the pack, not just cool it | Enables cold-weather fast charging and preconditioning | Increasingly standard |
↔ swipe the table sideways
If you live somewhere hot and plan to use DC charging regularly, active liquid cooling is not a luxury feature. A passively cooled pack in a 40 °C climate will derate hard on the second consecutive fast charge and will age noticeably faster. Ask what the pack cooling is before you ask about the peak kW.
09 — PreconditioningThe single most underused feature in modern EVs
Because temperature gates power so severely, the smartest cars now warm the battery before you arrive at a charger. This is called preconditioning, and it is typically triggered automatically when you set a DC charger as a navigation destination — or manually, from a menu, on cars that expose the control.
The car uses energy from the pack, plus waste heat from the motor and inverter, plus a resistive heater or heat pump, to bring cells into the optimal band during the last twenty to thirty minutes of driving. It costs a small amount of range. It can easily halve the charging session that follows.
| Scenario | Pack temp on arrival | Peak power achieved | 10–80% time | Range cost |
|---|---|---|---|---|
| No preconditioning, short drive | 2 °C | ~30 kW | 75–90 min | none |
| No preconditioning, long motorway drive | 18 °C | ~100 kW | 40 min | none |
| Preconditioned via navigation | 30 °C | ~150 kW | 26 min | 2–5 kWh |
| Summer, no preconditioning needed | 28 °C | ~150 kW | 27 min | none |
↔ swipe the table sideways
If you take one operational habit away from this article, make it this: in cold weather, always route to the charger through the car’s own navigation system, even if you know the way. It is the difference between a coffee stop and a meal.
10 — Real numbersHow long things actually take
Here is the comparison in its most practical form: one representative 60 kWh car, charged from 20% to 80% — the window that matters — on every tier.
| Charger | Effective power | Time | What you’d be doing |
|---|---|---|---|
| Level 1 socket, 2.3 kW | 2.1 kW after losses | 17 hr 10 min | Two nights |
| Wallbox, 7.4 kW | 7.0 kW | 5 hr 08 min | Sleeping |
| Wallbox 3-phase, 11 kW | 10.4 kW | 3 hr 28 min | A working afternoon |
| Public AC, 22 kW (car limited to 11) | 10.4 kW | 3 hr 28 min | Dinner and a film |
| DC 50 kW | ~46 kW average | 47 min | A proper lunch |
| DC 150 kW | ~88 kW average | 25 min | Coffee and a walk |
| DC 350 kW (car limited to 150) | ~88 kW average | 25 min | Identical — and often pricier |
↔ swipe the table sideways
The final row deserves emphasis. Plugging a 150 kW-capable car into a 350 kW pillar does not make it charge faster. Some networks price ultra-rapid bays at a premium. Know your car’s DC ceiling and do not pay for headroom you cannot use.
The journey view
Charging speed matters differently depending on the trip. Below, the same 60 kWh car on three journey types.
| Journey | Strategy | Driving time | Charging time | Total |
|---|---|---|---|---|
| 45 km daily commute | Home wallbox overnight | 50 min | 0 min of your time | 50 min |
| 45 km daily commute | Weekly DC top-up | 50 min | ~5 min/day amortised, plus detour | 60+ min |
| 350 km trip | Leave home at 100%, no stop | 3 hr 40 min | 0 min | 3 hr 40 min |
| 700 km trip | One long stop to 100% | 7 hr 20 min | 62 min | 8 hr 22 min |
| 700 km trip | Two short stops, 10→65% each | 7 hr 25 min | 38 min total | 8 hr 03 min |
↔ swipe the table sideways
Two short stops beat one long one, almost always. This is the practical consequence of the taper, and good route planners now do this arithmetic automatically.
11 — MoneyWhat each kind of charging actually costs
Charging speed and charging cost are strongly correlated, and not in your favour. Fast charging is expensive for reasons that are structural rather than greedy: the hardware costs an order of magnitude more per unit installed, the grid connection is larger and attracts standing charges, operators pay demand charges based on peak draw, the equipment needs maintenance, and utilisation is unpredictable.
| Source | Relative unit price | Why | Best used for |
|---|---|---|---|
| Home, off-peak tariff | 1.0× | Wholesale-linked night rate | Everything, whenever possible |
| Home, standard tariff | 1.6× | Flat domestic rate | Default if no smart tariff |
| Home with rooftop solar | 0.2–0.5× | Self-consumed generation | Daytime charging |
| Workplace | 0–1.0× | Often subsidised as a benefit | Commuters without home charging |
| Public AC, kerbside | 1.8–2.5× | Installation and billing overhead | Overnight for flat dwellers |
| DC 50 kW | 2.5–3.5× | Hardware and grid connection | Occasional top-ups |
| DC ultra-rapid | 3.0–4.5× | Demand charges, cooling, siting | Long journeys only |
↔ swipe the table sideways
The 90/10 pattern
Surveys of EV owners with home charging consistently find that roughly 80 to 90 percent of all energy is taken at home, overnight, at the cheapest rate available. DC fast charging accounts for a small slice of total energy but a disproportionate slice of total spend. Understanding this is what turns an EV from a cost-neutral proposition into a genuinely cheap one to run.
12 — LongevityWhat fast charging really does to battery life
This is the question everyone asks, and it deserves a careful answer rather than either reassurance or alarm.
The two kinds of ageing
Batteries degrade along two independent paths.
Calendar ageing happens simply with the passage of time, and depends mostly on temperature and state of charge. A pack sitting at 100% charge in a hot car park degrades measurably faster than one sitting at 50% in a cool garage — even if it is never driven. For many owners, calendar ageing is the larger contributor.
Cycle ageing happens with use: each charge and discharge causes small mechanical strain as the electrodes expand and contract, plus incremental growth of the surface film on the anode. Depth of discharge, current, and temperature all modulate the rate.
What the evidence supports
Large fleet datasets and independent teardown studies converge on a nuanced picture. Occasional DC fast charging on a modern, actively cooled pack has a small effect — small enough to be hard to separate from ordinary variation. The effect becomes significant when several factors compound:
- DC charging is the primary method, used several times a week rather than occasionally.
- Ambient temperatures are consistently high and the pack has weak or no active cooling.
- Sessions routinely run past 80% at high current.
- The car is fast-charged immediately after hard driving, when the pack is already hot.
- The car is fast-charged from very cold without preconditioning.
Use DC fast charging freely on road trips. Do not use it as your everyday method if you have any alternative. The concern is not any single fast charge — it is the accumulated pattern of thousands of them combined with heat.
Chemistry changes the calculus
Not all lithium-ion cells respond the same way.
| Chemistry | Energy density | Fast-charge tolerance | Cold-weather behaviour | Charging habit |
|---|---|---|---|---|
| NMC / NCA | High | Good with cooling | Moderate | Keep between 20–80% daily |
| LFP | Lower | Very good; tolerant of full charges | Weaker; needs more preheating | Charge to 100% regularly for calibration |
| LMFP | Between the two | Good | Improved over LFP | As per LFP |
| Silicon-blended anode | Very high | Improving; faster intercalation | Varies | Follow manufacturer guidance |
| Solid state (emerging) | Very high | Potentially excellent | Needs warmth | Not yet in volume production |
↔ swipe the table sideways
The LFP row contains an important exception to conventional advice. LFP cells have a very flat voltage curve, which makes it hard for the BMS to estimate state of charge accurately. Manufacturers of LFP cars therefore usually recommend charging to 100% periodically — often weekly — precisely so the BMS can recalibrate at a known reference point. Applying NMC habits to an LFP car degrades the accuracy of the range display without benefiting the cells.
13 — The gridWhy slow charging is quietly the smarter system
Zoom out from the individual car and the picture changes again. From a grid operator’s perspective, millions of vehicles slowly absorbing power overnight is close to ideal, while thousands drawing megawatts unpredictably at 6 pm is a problem.
Load shape
Electricity demand peaks in the early evening. Overnight, demand collapses while baseload generation and wind output continue. Slow overnight charging fills that valley, improving the utilisation of existing infrastructure without a single new power plant. This is why utilities offer cheap night tariffs — they are paying you to be convenient.
Managed and bidirectional charging
Slow charging is also the only tier where sophisticated control makes sense, precisely because it has hours of slack.
- Smart charging shifts the session to the cheapest, cleanest hours automatically.
- Solar matching modulates current to soak up exactly the surplus your roof is generating.
- V2H (vehicle-to-home) lets the car power the house during an outage or an expensive peak.
- V2G (vehicle-to-grid) lets aggregated fleets provide frequency response and paid grid services.
There is an environmental corollary. The carbon intensity of electricity varies hour by hour. Charging overnight in a wind-rich grid, or at midday in a solar-rich one, can meaningfully lower the emissions of every kilometre you drive — with no change to the car and no cost to you. Slow charging is the only tier flexible enough to exploit that.
14 — Engineering800 volts, and how fast charging got fast
Return to Power = Volts × Amps. To reach 350 kW on a 400 V pack you need roughly 875 A, which demands a cable so thick it would be unliftable unless actively cooled, and pack busbars heavy enough to hurt efficiency. Raise the pack to 800 V and the same 350 kW needs only about 440 A — half the current, and therefore roughly a quarter of the resistive heat.
Higher voltage brings second-order benefits too: lighter wiring across the whole car, a more efficient inverter when paired with silicon-carbide semiconductors, and faster cabin heating. The costs are real — every high-voltage component needs higher-rated insulation, and service technicians need additional training — but the trend is clearly toward 800 V and beyond for anything positioned as a fast-charging vehicle.
What else is coming
- Silicon-dominant anodes. Silicon holds far more lithium than graphite and accepts it faster, but swells enormously when charged. Solving that mechanical problem unlocks both range and charge rate.
- Solid-state electrolytes. Replacing the liquid electrolyte with a solid one removes the flammable component and may suppress dendrite growth, potentially allowing much higher currents safely.
- Cell-level tab and stack redesign. Shorter internal electrical paths cut resistance without changing chemistry — an unglamorous but effective route to faster charging.
- Battery swapping. Deployed at scale in China and for two- and three-wheelers in India, swapping sidesteps the physics entirely by charging packs slowly off-vehicle. Its constraint is standardisation, not engineering.
- Bidirectional as standard. As V2H and V2G hardware becomes routine, the humble home wallbox becomes the most valuable charging device you own.
15 — PracticeA working playbook
Everything above condenses into a fairly short set of habits. None of them require effort once established.
If you can charge at home
- Install a wallbox sized to your supply — 7.4 kW single-phase is plenty for almost everyone.
- Get a time-of-use tariff and set the car or the wallbox to charge in the cheap window.
- Set a daily charge limit of 80% for NMC chemistry. Charge to 100% only before a long trip, and leave soon after.
- For LFP, follow the manufacturer’s guidance — usually 100% weekly.
- Plug in most nights. Shallow, frequent top-ups are gentler than deep cycles.
- Reserve DC fast charging for journeys that genuinely need it.
If you cannot charge at home
- Prioritise workplace or destination AC charging — a full working day at 7 kW is 50 kWh.
- Look for slower, cheaper AC posts for routine energy and treat DC as the exception.
- If DC is unavoidable, use 50–100 kW units rather than ultra-rapid where possible: cheaper, gentler, and usually less busy.
- Charge in the 10–80% band and don’t sit at high state of charge in hot weather.
- Favour chemistry that tolerates this pattern — LFP is a strong fit for DC-dependent owners.
On a long journey
- Set the charger as a navigation destination so the car preconditions.
- Arrive low — around 10–15% — to catch the top of the curve.
- Leave at 60–80%, not 100%. Two short stops beat one long one.
- Charge while you were going to stop anyway. Time spent charging during lunch costs nothing.
- Don’t pay ultra-rapid rates if your car can’t use the power.
16 — CorrectionsEight persistent myths
| The claim | Reality |
|---|---|
| “Fast charging destroys batteries” | Occasional DC use on an actively cooled pack has a small, measurable but manageable effect. Heat and constant high state of charge matter more. |
| “A 350 kW charger charges any car at 350 kW” | The car dictates the rate. A 150 kW car gets 150 kW at most, from any pillar. |
| “22 kW AC will charge my car in two hours” | Only if the on-board charger accepts 22 kW. Most accept 7.4 or 11 kW. |
| “Charging to 100% is always harmful” | Sitting at 100% for long periods in heat is the harmful part. Charging to 100% and leaving is fine — and required periodically on LFP. |
| “Slow charging wastes more energy” | Charging losses are typically 8–15% on AC and 5–10% on DC, but a slow charge also avoids the energy spent on active pack cooling. The difference is small either way. |
| “You should run the battery flat before recharging” | That’s nickel-cadmium advice from the 1990s. Lithium-ion prefers shallow, frequent cycles. |
| “Cold weather just reduces range” | It reduces charging speed too, often more dramatically than range. Preconditioning is the fix. |
| “EVs will collapse the grid” | Uncontrolled peak-time charging would stress local networks. Managed overnight charging improves grid utilisation and is what tariffs are designed to encourage. |
↔ swipe the table sideways
17 — QuestionsFrequently asked
Can I leave my EV plugged in all the time?
Yes. Once the car reaches its set limit, charging stops and the pack is not held at high current. Many owners leave the car plugged in continuously so the thermal management system can use grid power rather than battery power to condition the pack. Set a sensible charge limit and don’t think about it further.
Does using a fast charger void my warranty?
No. Battery warranties are written on the assumption that DC charging is used. What is typically excluded is damage from physical abuse, unapproved modification, or ignoring explicit manufacturer warnings. Normal fast-charger use is normal use.
Why did my car charge slower today than last week at the same pillar?
Most often temperature — either a cold pack or an already-hot one. Other causes: a higher starting state of charge, power sharing with a car in the adjacent bay, a derated or faulty pillar, or grid constraints at the site.
Is it bad to fast-charge immediately after hard driving?
The pack is already warm, so the cooling system starts at a disadvantage and the BMS may derate. It isn’t damaging in itself — the BMS won’t allow harmful conditions — but expect slower charging. A few minutes of gentle driving before the stop helps.
How much energy is lost during charging?
Roughly 8–15% on AC and 5–10% on DC, counting conversion losses, cell heating, and thermal management. Losses are proportionally worst at very low power, because the car’s own electronics draw a fixed overhead — one reason Level 1 charging is less efficient than it looks.
Should I buy a bigger battery or a faster-charging car?
If you have home charging and rarely take long trips, a smaller battery is cheaper, lighter, and more efficient. If you frequently drive long distances or lack home charging, charging speed and curve flatness matter more than raw capacity.
Do I need a 22 kW wallbox at home?
Almost certainly not. It requires three-phase supply, costs considerably more, and most cars can’t use it. A 7.4 kW unit adds more range overnight than the average driver uses in two days.
What is the single best habit for battery health?
Keep the pack away from extremes of both temperature and state of charge for long periods. Parked in the shade at 50% is the kindest thing you can do to a lithium-ion battery — and slow charging makes that trivially easy to arrange.
18 — ReferenceGlossary
- BMS — Battery Management System
- The controller that monitors every cell and dictates charging current, voltage, and limits.
- C-rate
- Charging power divided by battery capacity; a size-independent measure of stress.
- Charging curve
- The profile of delivered power against state of charge during a DC session.
- Derating
- Deliberate reduction of charging power by the BMS or the charger, usually for thermal reasons.
- Dendrite
- A needle-like growth of metallic lithium that can pierce the separator and cause a short circuit.
- Intercalation
- The process of lithium ions slotting between graphite layers in the anode.
- LFP
- Lithium iron phosphate — durable, tolerant of full charges, lower energy density.
- NMC
- Nickel manganese cobalt — higher energy density, prefers a 20–80% daily window.
- OBC — On-board charger
- The in-car AC-to-DC converter that sets your maximum AC charging rate.
- Plating
- Deposition of metallic lithium on the anode surface instead of intercalation; the main damage mechanism in fast charging.
- Preconditioning
- Warming or cooling the pack before charging so it can accept full power.
- SoC — State of charge
- How full the battery is, as a percentage.
- Taper
- The progressive reduction in DC charging power as state of charge rises.
- V2G / V2H
- Vehicle-to-grid and vehicle-to-home: discharging the car’s battery outward.
19 — ClosingThe pattern that actually works
The tidy summary is that fast and slow charging are not competitors. They solve different problems, and a well-run EV uses both in a specific and lopsided ratio.
Slow charging is the foundation. It is cheapest, gentlest on the cells, kindest to the grid, and — the point that consistently surprises people coming from petrol cars — it costs you no time at all, because it happens during hours you were already asleep or already at your desk. For the overwhelming majority of driving, the correct charger is a modest wallbox running quietly on a night tariff. The car is simply always full.
Fast charging is the enabler. It is what makes an electric car a car rather than a commuter appliance: it turns a 300 km range into an unlimited one, at the cost of a twenty-minute break every few hours. Used for that purpose, its effect on battery life is small enough that worrying about it is a poor use of attention. Used as a substitute for home charging — several times a week, in heat, to high states of charge — it becomes the expensive and slightly damaging option that its reputation suggests.
So the rule is not “avoid fast charging”. It is: let slow charging carry the load, and let fast charging buy you freedom on the days you need it. Understand the curve so you leave at the right moment. Precondition in winter. Keep the pack out of extremes when it’s parked. Beyond that, drive the car and stop thinking about the battery — which, in the end, is the point of all this engineering.